
Introduction
In this lesson, you will learn how to graph a line using the slope and y-intercept.
This video illustrates the lesson material below. Watching the video is optional.
Graphing a Line Using the Slope and Y-Intercept
The slope-intercept form of a line is
Example 1
Graph the following line that is given in y-intercept form:
You could graph this by substituting in values for x and solving for y, but with the slope-intercept form of a line, one of the points is already given (b, or the y-intercept). The y-intercept is at

Figure 1
You only need two points in order to determine a straight line. Use the slope (m), or
In other words, for every three units you go up, you take one step to the right. To plot the second point, follow these steps:
- Start at the point that you already have, which is known as the y-intercept,
- Go three units up and one unit to the right.
- You get to
Now that you have two points, you can draw a line between them, and that will be the graph of this line.
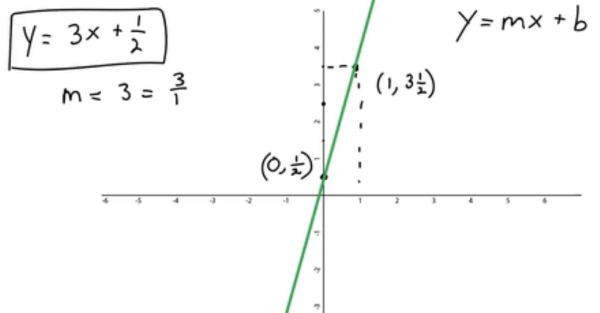
Figure 2
Example 2
Graph the following line that is given in y-intercept form:
Once again, you know the first point is at

Figure 3
Now you just need to find another point using the slope (m).
A negative slope goes from the top left down toward the bottom right. You can easily find the second point using this slope. It is really important to remember that the following slopes below are the same.
- You could either go down three and to the right four, which gives this point:
- Or, you could go up three and then to the left four and this point:
Either way, one of the directions needs to be in the negative direction, and the other needs to be in the positive direction.

Figure 4
Figure 4 shows the line of
Things to Remember
- You need a minimum of two points to find the line of an equation.
- Steps for graphing an equation using the slope and y-intercept:
- Step 1: Plot the y-intercept from the slope-intercept form.
- The y-intercept = b of the equation
- The point will be
- The y-intercept = b of the equation
- Step 2: Use the slope (m) or
- Make single steps, using the rise and run from the y-intercept.
- Plot the second point.
- Step 3: Connect those two points with your line.
- Step 1: Plot the y-intercept from the slope-intercept form.
Practice Problems
- Plot the line
Note: The graph you create may look slightly different depending on the spacing you choose for your x and y-axis. The correct graph should still have the same direction of slope and the x and y-intercepts should be the same.
Details:
To graph this line you need to identify the slope and the y-intercept. The equation is written in slope-intercept form,
Step 1: Find the slope and the y-intercept of the line:
The equation of the line is
So the slope is
Step 2: Graph the y-intercept:
This is a picture of a coordinate plane with the point
Step 3: Find another point on the line using the slope:
The slope is
This is a picture of a coordinate plane. The point
Step 4: Draw a line that passes through the points:
This is a picture of a coordinate plane with the points - Plot the line
Note: The graph you create may look slightly different depending on the spacing you choose for your x and y-axis. The correct graph should still have the same direction of slope and the x and y-intercepts should be the same.
- Plot the line
Note: The graph you create may look slightly different depending on the spacing you choose for your x and y-axis. The correct graph should still have the same direction of slope and the x and y-intercepts should be the same.
- Plot the line
Note: Your graph may look a little different depending on the spacing you choose for your x and y-axis. Notice in this graph the hash marks for the x-axis are farther apart than the hash marks for the y-axis. This artificially makes the graph look less steep than it is if the hash marks are the same distance apart. However, sometimes this is helpful in order to better fit the data into the graph.
- Plot the line
Note: In this graph, the spacing of the hash marks on the x and y-axis are spaced almost identically.
Details:
To graph this line you need to identify the slope and the y-intercept. The equation is written in slope-intercept form,
Step 1: Find the slope and the y-intercept of the line:
The equation of the line is:
Keep in mind that
So the slope is
Step 2: Graph the y-intercept:
This is a picture of a coordinate plane with the point
Step 3: Find another point on the line using the slope:
The slope is
This is a picture of a coordinate plane with the points
Step 4: Draw a line that passes through the points:
This is a picture of a coordinate plane with the points - Plot the line
