
Introduction
In this lesson, you will review the meaning of slope. The slope of a line represents how the y-axis values change compared to the numbers on the x-axis. This is also called the rate of change.
Interpreting Slope
Review the following definitions in preparation for this lesson:
- Positive slope: Y-values are growing compared to the x-values.
- Negative slope: Y-values are decreasing/decaying compared to the x-values.
- 0-slope: There is no change in y-values compared to the x-values.
- The larger the slope, the steeper the line, or in other words, the greater the rate of change.
- The smaller the slope, the slower the growth or decay and slower the rate of change.
- The rate of change tells you how much change there is over a single unit of measure. It can also help you forecast what will happen in the future.
Example 1
The following table has the data for the height of a plant at different times. Note: The plant is already 40 mm tall when the data starts to be collected.
Just looking at this data, it is hard to visualize what the data is telling you, but a graph can help. In this case, the independent variable (x-axis) is time because time happens whether the plant grows or not. It is not dependent on the height of the plant. The y-axis is the dependent variable because the height of the plant depends on how long it has been growing.
| Time in Hours (x-axis) | Height in mm (y-axis) |
| 0 | 40 |
| 1 | 78 |
| 3 | 154 |
| 10 | 420 |
| 18 | 724 |
Simply looking at this data, it is hard to know what it means. Does this mean the plant is growing quickly, or slowly, or not at all? A graph can help you visualize this.

Figure 1
Figure 1 shows the data on a graph. You can use the data and the graph to calculate the slope of the line. This slope tells you how much the plant grows on average each hour. In other words, the slope is the rate of change, or in this case, the rate of growth.
Find the Slope
Stair Step Method
You see the growth of the line between \(x=0\) and \(x=1\) is the growth over one unit on the x-axis. You can use the y-values from the table above to calculate the rise of this stair step.
Below is a portion of the graph zoomed in between \(x=0\) and \(x=1\).

Figure 2
It is important to note that the scale of the x-axis numbers is different than the scale of the y-axis numbers. This is why the amount of change in the x direction is 1 and the amount of change in the y direction is 38. This means the slope is 38.
Slope Formula Method
\begin{align*}\text{slope}= \text{m} = \frac{\text{rise}}{\text{run}}=\frac{\text{change in y values}}{\text{change in x values}} \end{align*}
This information shows that within one hour, the plant grows 38 mm. This is the slope. Since the line is a straight line, the slope for the rest of the line is the same. You can use this to answer some of the following types of questions including forecasting what will happen in the future.
Practice Problems
Use the previous information from this lesson about the growth of a plant to answer each of the following questions:- Assuming the growth remains the same, how much will the plant grow in the next hour? (
- Assuming the growth remains the same, how tall will the plant be at the end of the next hour? (
- How tall will the plant be at the end of one day (24 hours)? (
Details:
You can use the slope to help forecast the graph. The first way to do this is to extend the line out to when \(x=24\) to estimate the point. A more accurate way to forecast is to add the rate of change for every additional hour needed up to 24 hours.
In this case, the last height measurement was at 18 hours and was 724 mm. If the plant grows at this same rate for 6 more hours it will grow \(6\times38=228\; \text{mm}\) more. Thus, at the end of one day (24 hours) it will be \(724+228=952\;\text{mm}\) tall.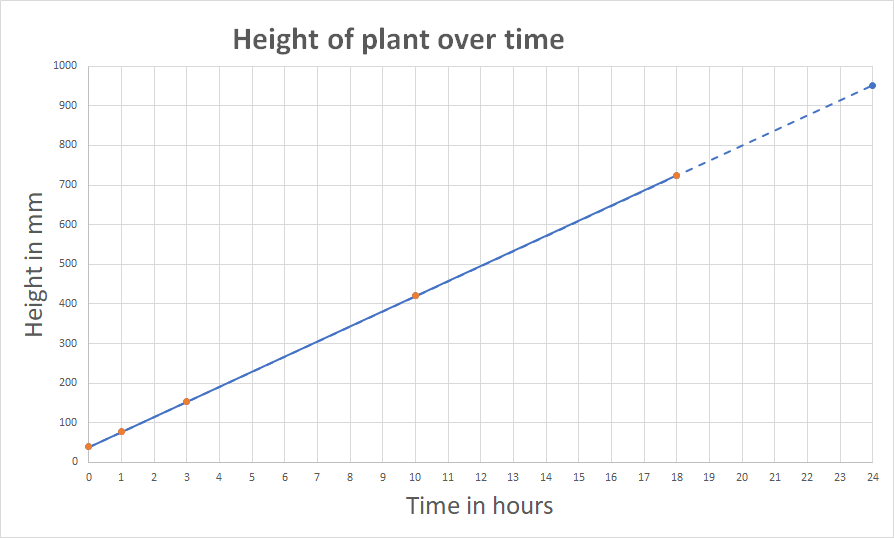
The plant in this lesson is bamboo. It is one of the fastest growing plants in the world and can grow up to 912 mm a day, close to three feet per day.
You can see this is significant by comparing the rate of change of the bamboo plant to the rate of change of kudzu, another fast growing plant. The data for the kudzu are shown in this table.
| Time in Hours (x-axis) | Height in mm of Bamboo (y-axis) | Height in mm of Kudzu (y-axis) |
| 0 | 40 | 40 |
| 1 | 78 | 53 |
| 3 | 154 | 79 |
| 10 | 420 | 170 |
| 18 | 724 | 274 |
| 24 | 952 |
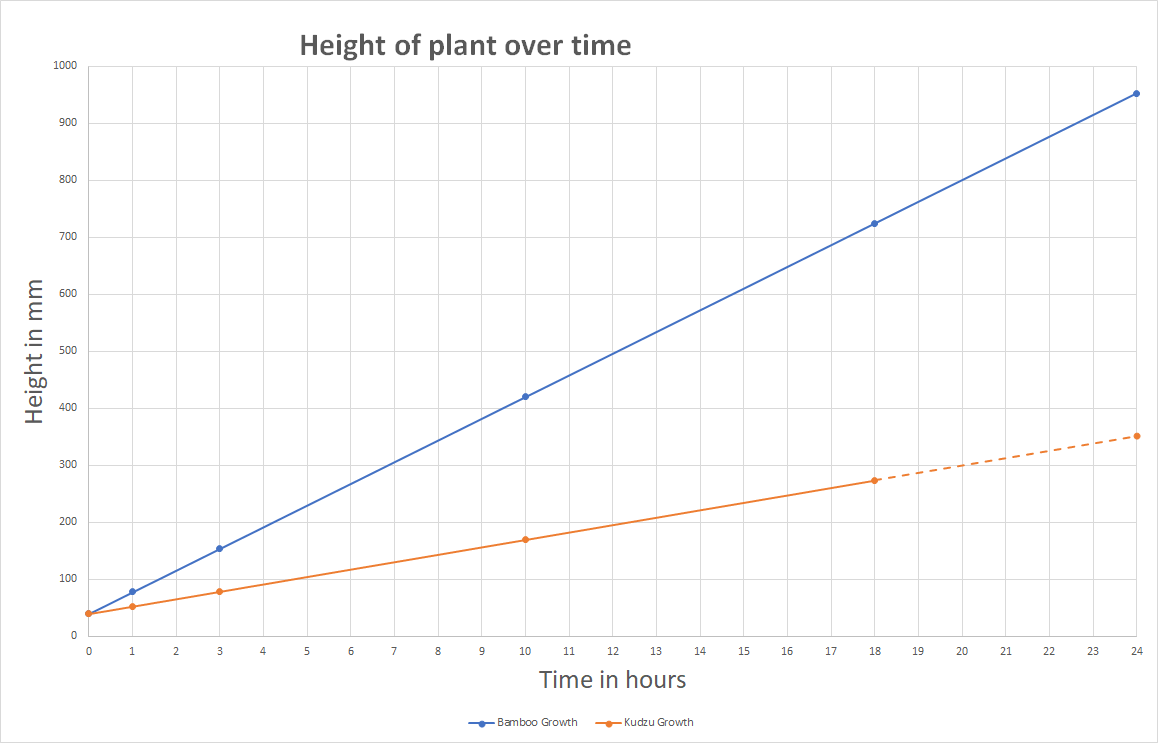
Figure 3 is a graph that shows the line for the growth of bamboo (blue line) and the line for kudzu (orange line).

Figure 3
By looking at the data on the graph you can see the rate of change of bamboo is much greater than the rate of change of kudzu even though both grow quickly. You can use the graph for kudzu to also answer many of the same questions as you answered for bamboo, but first you must find the slope for kudzu’s growth.

Figure 4
Use the stair step method. The step is 8 units long. In order to find the rate of change for the step, divide the rise by the run.
\begin{align*}\frac{\text{rise}}{\text{run}}=\frac{104}{8}=\frac{13}{1}=13\end{align*}
This means the rate of change for kudzu is 13 mm/hour.
You can use this to now answer the questions for kudzu.
Practice Problems
Use the previous information from this lesson about the growth of kudzu to answer each of the following questions:
4. Assuming the growth of the kudzu remains the same, how much will the plant grow in the next hour? (Details:
The last data point was at 18 hours, so this wants to know how tall it will be 6 hours later.
In 6 hours the kudzu will grow \(6x\times13=78\; \text{mm}\).
This means the total height at 24 hours will be \(274+78=352\; \text{mm}\).
If you extend the line out to 24 hours you can see this on the graph.
Need More Help?
- Study other Math Lessons in the Resource Center.
- Visit the Online Tutoring Resources in the Resource Center.
- Contact your Instructor.
- If you still need help, Schedule a Tutor.