
Introduction
In this lesson, you will graph (or plot) a linear equation by finding two or more points on the line and then connecting those points with a line. To find points on the line, choose any value for x, then plug that number into the function to solve for the unknown variable y. A linear equation is simply a straight line.
These videos illustrate the lesson material below. Watching the videos is optional.
- Plotting a Line in Slope-Intercept Form (07:51 mins) | Transcript
- Graphing any Linear Equations (Straight Line) (05:18 mins) | Transcript
Plotting a Line in Slope-Intercept Form
Linear equations that are in slope-intercept form are written in this format:
\begin{align*} y = mx + b\end{align*}
Example 1
Plot a line using the following linear equation: \(y=\frac{1}{2}x+1\).
Figure 1 shows a table of coordinates to plot this line. The x values are on the left and the y values are on the right since that's how they will be ordered in coordinate pairs. Four values for x are chosen that will be easy to calculate \(x = -1, 0, 1, 5\). It is only necessary to do two points, but doing more will help you check for mistakes.

Figure 1
Solve for the y values. Begin by substituting -1 for \(x\).
\begin{align*} & y = \frac{1}{2}x + 1 &\color{red}\small\text{Start with the linear equation}\\\\ & y = \frac{1}{2} (-1) + 1 &\color{red}\small\text{Substitute \(-1\) for \(x\)}\\\\ & y = \frac{-1}{2} + 1 &\color{red}\small\text{Multiply \(\frac{1}{2}\) by \(-1\) is \(\frac{-1}{2}\)}\\\\ & y = \frac{-1}{2} + \frac{2}{2} &\color{red}\small\text{Common denominator is \(2\)}\\\\ & y = \frac{1}{2} &\color{red}\small\text{Simplify the fraction} \end{align*}
Now, substitute 0 for \(x\).
\begin{align*} & y = \frac{1}{2}x + 1 &\color{red}\small\text{Start with the linear equation}\\\\ & y = \frac{1}{2} (0) + 1 &\color{red}\small\text{Substitute \(0\) for \(x\)}\\\\ & y = 0 + 1 &\color{red}\small\text{Multiply \(\frac{1}{2}\) by \(0\) is \(0\)}\\\\ & y = 1 &\color{red}\small\text{Simplify by adding} \end{align*}
Now, substitute 1 for \(x\).
\begin{align*} & y = \frac{1}{2}x + 1 &\color{red}\small\text{Start with the linear equation}\\\\ & y = \frac{1}{2} (1) + 1 &\color{red}\small\text{Substitute \(1\) for \(x\)}\\\\ & y = \frac{1}{2} + 1 &\color{red}\small\text{Multiply \(\frac{1}{2}\) by \(1\) is \(\frac{1}{2}\)}\\\\ & y = \frac{1}{2} + \frac{2}{2} &\color{red}\small\text{Common denominator is \(2\)}\\\\ & y = \frac{3}{2} &\color{red}\small\text{Addition}\\\\& y = 1.5 &\color{red}\small\text{Express as a decimal} \end{align*}
Finally, substitute 5 for \(x\).
\begin{align*} & y = \frac{1}{2}x + 1 &\color{red}\small\text{Start with the linear equation}\\\\ & y = \frac{1}{2} (5) + 1 &\color{red}\small\text{Substitute \(5\) for \(x\)}\\\\ & y = \frac{5}{2} + 1 &\color{red}\small\text{Multiply \(\frac{1}{2}\) by \(5\) is \(\frac{5}{2}\)}\\\\ & y = \frac{5}{2} + \frac{2}{2} &\color{red}\small\text{Common denominator is \(2\)}\\\\ & y = \frac{7}{2} &\color{red}\small\text{Addition}\\\\ & y = 3.5 & \color{red}\small\text{Express as decimal} \end{align*}
With these points (-1, 0.5), (0, 1), (1, 1.5), and (5, 3.5), you can plot the line (graph the equation) by drawing a line that connects the points.

Figure 2
Graphing Any Linear Equation (Straight Line)
Not all equations come in slope-intercept form, but you can still graph them. You can graph an equation in standard form, where all of the variables are on the same side of the equation.
Standard form is written in this format:
\begin{align*} Ax + By = c \end{align*}
Similar to the first part of this lesson, you will find two or more points to plot, then connect them to form the line.
Example 2
Plot a line using this linear equation in standard form: \(2x+3y=10\).
Start by making a table. The x value is on the left, and the y value is on the right. Next, find values that will be easy to calculate. In this example, you will see coordinates calculated when x is 0 and when y is 0.

Figure 3
Solve for the y value. Substitute 0 for \(x\).
\begin{align*} & 2x+3y=10 &\color{red}\small\text{Start with the linear equation}\\\\ & 2(0)+3y=10 &\color{red}\small\text{Substitute \(0\) for \(x\)}\\\\ & 0+3y=10 &\color{red}\small\text{Multiply \(2\) by \(0\) is \(0\)}\\\\ & 3y = 10 &\color{red}\small\text{Simplify the left side}\\\\ & \frac{3}{\color{red} 3} y = \frac{10}{\color{red}3} &\color{red}\small\text{Divide both side by \(3\)}\\\\ & \frac{\cancel 3}{\color{red}\cancel 3} y = \frac{10}{\color{red}3} &\color{red}\small\text{Cancel the \(3\)'s on the left side}\\\\ & y = \frac{10}{3} &\color{red}\small\text{The value of y is isolated}\\\\ & y = 3.33 &\color{red}\small\text{Express as a decimal} \end{align*}
Now solve for the x value when y is 0.
\begin{align*} & 2x+3y=10 &\color{red}\small\text{Start with the linear equation}\\\\ & 2x+3(0)=10 &\color{red}\small\text{Substitute \(0\) for \(y\)}\\\\ & 2x+0=10 &\color{red}\small\text{Multiply \(3\) by \(0\) is \(0\)}\\\\ & 2x = 10 &\color{red}\small\text{Simplify the left side}\\\\ & \frac{2}{\color{red} 2} x = \frac{10}{\color{red}2} &\color{red}\small\text{Divide both side by \(2\)}\\\\ & \frac{\cancel 2}{\color{red}\cancel 2} x = \frac{10}{\color{red}2} &\color{red}\small\text{Cancel the \(2 \)'s on the left side}\\\\ & x = \frac{10}{2} &\color{red}\small\text{The value of x is isolated }\\\\ & x = 5 &\color{red}\small\text{Simplify the right side} \end{align*}
Figure 4 shows these values added to the table.

Figure 4
With these points (0, 3.33), (5, 0), you can plot the line (graph the equation) by drawing a line that connects the points.

Figure 5
This means that any point along this line will make this equation correct. For example, it looks like the point (2,2) where x is 2 and y is 2 is on this line. To find out if this is correct, plug the point (2,2) into the equation for the value of x and y, and check if you get 10.
\begin{align*} &2x + 3y = 10 &\color{red}\small\text{Start with the linear equation}\\\\ &2 (2) + 3 (2) = 10 &\color{red}\small\text{Check if \((2, 2)\) is true}\\\\ &4 + 6 = 10 &\color{red}\small\text{Multiply the left side}\\\\ & 10 = 10 &\color{red}\small\text{Add the left side}\end{align*}
Since 10=10 is a true statement, the point (2, 2) does lie on the line above. Any other point in this line will also satisfy this equation and make it true.

Figure 6
Things to Remember
- To find points on the line, choose any value for x, then plug that number in the function and solve for y.
- Pick values for x that are easy to calculate for the value of y.
- Plot points and draw a line through the points.
Practice Problems
1. Match the equation of the line with its graph.a. \({\text{y}}=4{\text{x}}-3\) (
b. \({\text{y}}=-2{\text{x}}+3\) (
c. \({\text{y}}= \dfrac{1}{3}{\text{x}}\) (
Details:
The equation, \(y={\color{Red}4}x−{\color{Blue}3}\), is written in slope-intercept form, which is \(y = {\color{Red}m}x + {\color{Blue}b}\), where m is the slope and b is the y-intercept. You need to find the graph that has a \({\color{Red}slope}\) of \({\color{Red}4}\) and a \({\color{Blue}y-intercept}\) of \({\color{Blue}-3}\).
First, look at Graph #1. You see that the y-intercept is 3 and the slope is negative. It is not the correct graph.

Then look at Graph #2. You see that the y-intercept is \(−3\) and the slope is positive. The rise is 4 and the run is 1, so the slope is \(m=\dfrac{4}{1}\), which is equal to 4. This is the correct graph.

You can also check Graph #3. You see that the y-intercept is 0 and the slope is positive. The rise is 1 and the run is 3 so the slope is \(m=\dfrac{1}{3}\). This is not the correct graph.


3. 
\({\text{y}}=2{\text{x}}-5\) (
Note: Your line may look different than this one, but the x-intercept and the y-intercept should be the same.

\({\text{y}}=\dfrac{-1}{2} {\text{x}}+2\) (
Note: Your line may look different than this one, but the x-intercept and the y-intercept should be the same.

\(3{\text{x}}+4{\text{y}}=-12\) (
Note: Your line may look different than this one, but the x-intercept and the y-intercept should be the same.

\(\dfrac{1}{3}{\text{x}}{-}{\dfrac{1}{2}}{\text{y}}=5\) (
Note: Your line may look different than this one, but the x-intercept and the y-intercept should be the same.

Details:
To graph the line, \(\dfrac{1}{3}{\text{x}}{-}{\dfrac{1}{2}}{\text{y}}=5\) , you need to find at least two points that are on the line. Start with a table of values:
| x | y | ||
|---|---|---|---|
| - | - | ||
| - | - |
To find the y-intercept, plug in 0 for x and find the corresponding y-value:
\({\dfrac{1}{3}(0)}{-}{\dfrac{1}{2}}{\text{y}}=5\)
You know that \(\dfrac{1}{3}\times0=0\) so the equation now reads:
\(0-\dfrac{1}{2}{\text{y}}=5\)
Which equals:
\(-\dfrac{1}{2}{\text{y}}=5\)
Next, multiply both sides by \(-\dfrac{2}{1}\) to cancel out the \(-\dfrac{1}{2}\) and solve for y. You also write 5 as \(\frac{5}{1}\) to make solving easier:
\(\left(-\dfrac{2}{1}\right)\left(-\dfrac{1}{2}{\text{y}}\right)=\dfrac{5}{1}\left(-\dfrac{2}{1}\right)\)
On the left side you multiply \(\left(-\dfrac{2}{1}\right)\times\left(-\dfrac{1}{2}\right)\) together which equals 1. You now have:
\(1{\text{y}}=\dfrac{5}{1}\left(-\dfrac{2}{1}\right)\)
To multiply \(\dfrac{5}{1}\times\left(-\dfrac{2}{1}\right)\), you multiply straight across which equals \(-\frac{10}{1}\).
\(1{\text{y}}= -\dfrac{10}{1}\)
Which simplifies to:
\(1{\text{y}}=-10\)
So the point \((0,−10)\) is on the line and you can update the table accordingly.
| x | y | ||
|---|---|---|---|
| 0 | -10 | ||
| - | - |
To find the x-intercept, follow the same process plugging in 0 for y and then finding the corresponding x-value:
\(\dfrac{1}{3}{\text{x}}{-}{\dfrac{1}{2}}\left(0\right)=5\)
Which equals:
\(\dfrac{1}{3}{\text{x}}{-}0=5\)
Which equals:
\(\frac{1}{3}{\text{x}}=5\)
Then multiply both sides by 3:
\((3)(\dfrac{1}{3}){\text{x}}=5(3)\)
Which gives you:
\((\cancel{3})(\dfrac{1}{\cancel{3}}){\text{x}}=5(3)\)
and
\({\text{x}}=15\)
Now you have an additional point \((15,0)\).
| x | y | |||
|---|---|---|---|---|
| 0 | -10 | |||
| 15 | 0 |
Using the points \((15,0)\) and \((0,−10)\) you can graph the line. First, graph the points:

Then draw a line through both points:

\({\text{y}}=-3{\text{x}}+2\) (

Details:
The equation of this line is \(y=−3x+{\color{Red}2}\) and it is written in slope-intercept form, which is \(y=mx + {\color{Red}b}\), where m is the slope and \({\color{Red}b}\) is the \({\color{Red}y-intercept}\). So the y-intercept is (0,2).
Now, choose an x-value (besides \(x=0\)) and plot the point on the line \(y=−3x+2\) that corresponds to this value. Then, use these two points to graph the line. (
Note: Answers will vary depending on what value of x you choose. Several possible points are shown. All correct points will lie upon the line, but since the line is infinite it is impossible to show the entire line or all possible points on it.

Details:
You want to graph this line and already have the y-intercept which is \((0, 2)\). You need one more point to graph the line. For this example, choose \({\color{Red}x = 1}\) and find the corresponding y-value (you can choose any value for x. This example shows choosing x = 1 for convenience). The equation is:
\(y=−3{\color{Red}x}+2\)
Replace x with \({\color{Red}1}\):
\(y=−3{\color{Red}(1)}+2\)
Then simplify:
\(y=−{\color{Red}3}+2\)
Then add which gives you:
\(y=−1\)
So another point on the line is \((1,−1)\). Now you can graph both points:

Then draw a line through both points to graph the line:

\({\text{y}} = \dfrac{1}{2}{\text{x}} - 3\) (
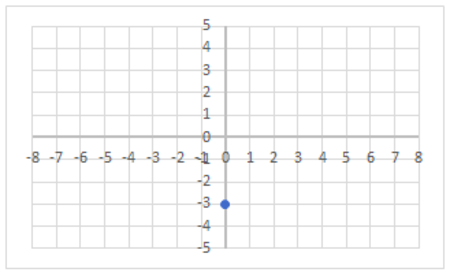
Note: Answers will vary depending on what value of x you choose. Several possible points are shown. All correct points will lie upon the line, but since the line is infinite it is impossible to show the entire line or all possible points on it.

\({\text{y}} = -\dfrac{3}{5}{\text{x}} + 1\) (
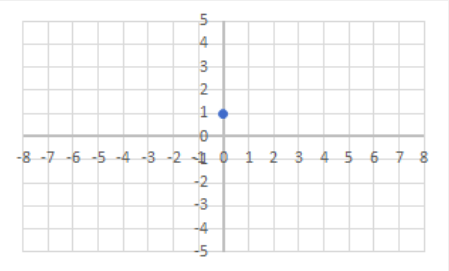
Now, choose an x-value (besides \(x=0\)) and plot the point on the line \({\text{y}} = -\dfrac{3}{5}{\text{x}} + 1\) that corresponds to this value. Then, use these two points to graph the line. (
Note: Answers will vary depending on what value of x you choose. Several possible points are shown. All correct points will lie upon the line, but since the line is infinite it is impossible to show the entire line or all possible points on it.

Need More Help?
- Study other Math Lessons in the Resource Center.
- Visit the Online Tutoring Resources in the Resource Center.
- Contact your Instructor.
- If you still need help, Schedule a Tutor.